
Visualizing information through methods such as charts, graphs, and maps, can play a key role in helping an audience understand complex sets of data. When used correctly, these visual tools should augment existing information in order to make the subject at hand clearer by providing additional layers of understanding that the reader or viewer would not get simply by reading text. Some of my favorite data visualizations come from the graphics department at The New York Times. Check out this one on Ebola patients and this one on foreign government contributions to think tanks.
Often times, however, visual information can become cluttered and disorienting—offering no meaningful insight into the data, or just flat out telling the wrong story. There is probably no greater example of this than in United States election maps. I’m sure that we can all agree that coloring an entire state, district, or county a stark red or blue based off of a 51/49% split is not an incredibly accurate representation of the voters as a whole in that specific area. If you want more information on this specific problem, you can read this great article.
There are plenty of these confusing and misleading infographics around, even ones that have been published by major, (supposedly) reputable organizations. I’ve compiled a list of some of my favorite, poorly-constructed data visualizations below, and offered a quick explanation for where exactly they went wrong.
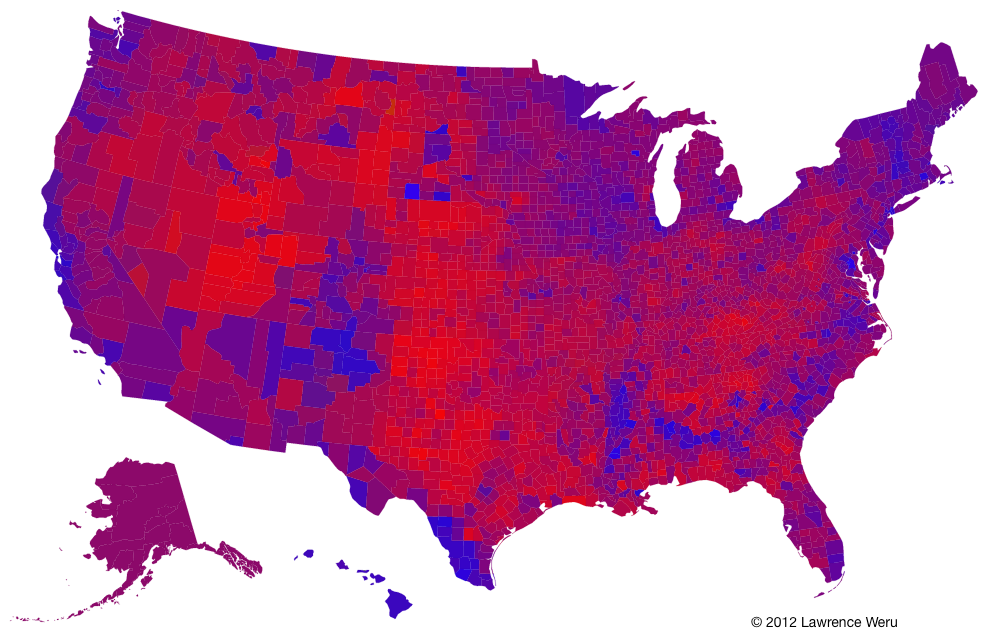
While a good effort was made to clarify the data beyond solid red and blue shapes, this election map makes it hard for the eye to distinguish between different shades of purple, ultimately muddling the information it tried so hard to accurately represent.
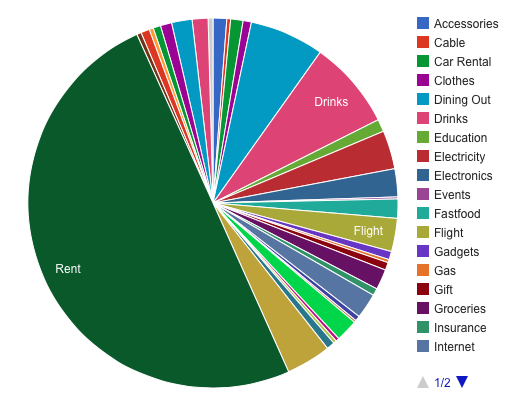
Pie charts are really horrible things. While they may be useful to see parts of a whole that add up 100%, without proper context they don’t really tell you much of anything. Especially when you have lots of categories. Lots and lots of categories.
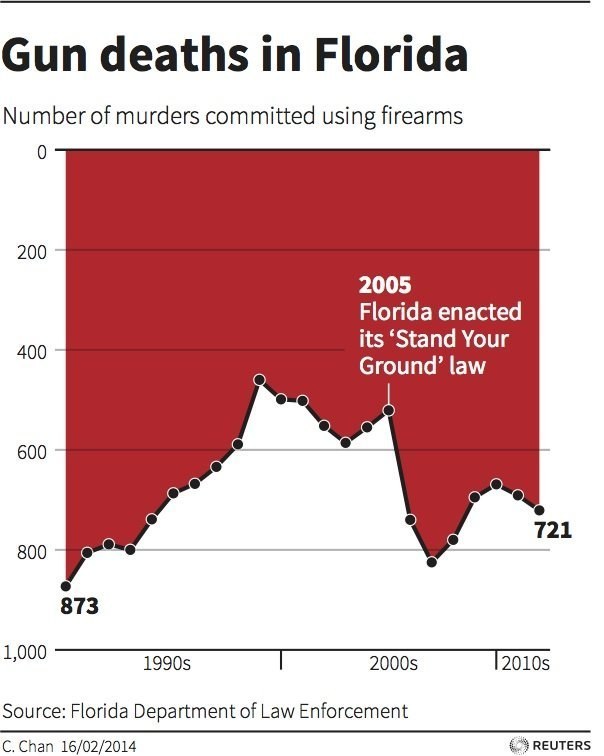
This FOX News Chart happened to flip the y-axis of this graph to make it appear as if there was a sharp decline in gun-related fatalities as opposed to a rather large increase.
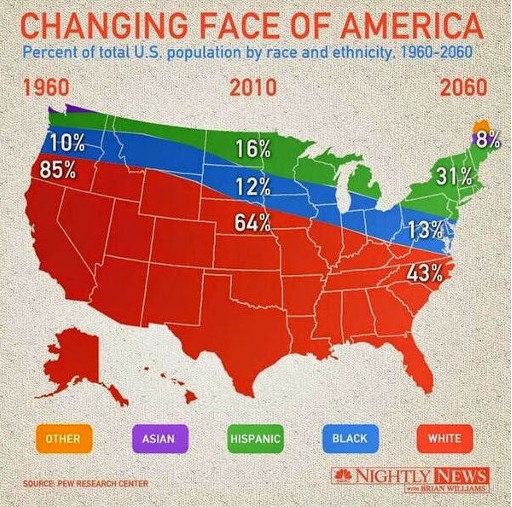
While the original graph done by Pew Research indicated an accurate depiction of the racial change in America, this NBC Nightly News visualization makes the implication that all Asians live in Maine.
https://www.buzzfeednews.com/article/katienotopoulos/graphs-that-lied-to-us#3nr24w7
https://www.fastcompany.com/3029318/the-worst-infographic-of-2014-so-far